Shaping Data Into a Story for Moody’s Analytics
As a global provider of financial intelligence and analytical tools, Moody’s Analytics empowers its clients with profound insights to make informed decisions. Their expertise in the economic landscape is second to none, with a strong focus on trends in housing and real estate markets.
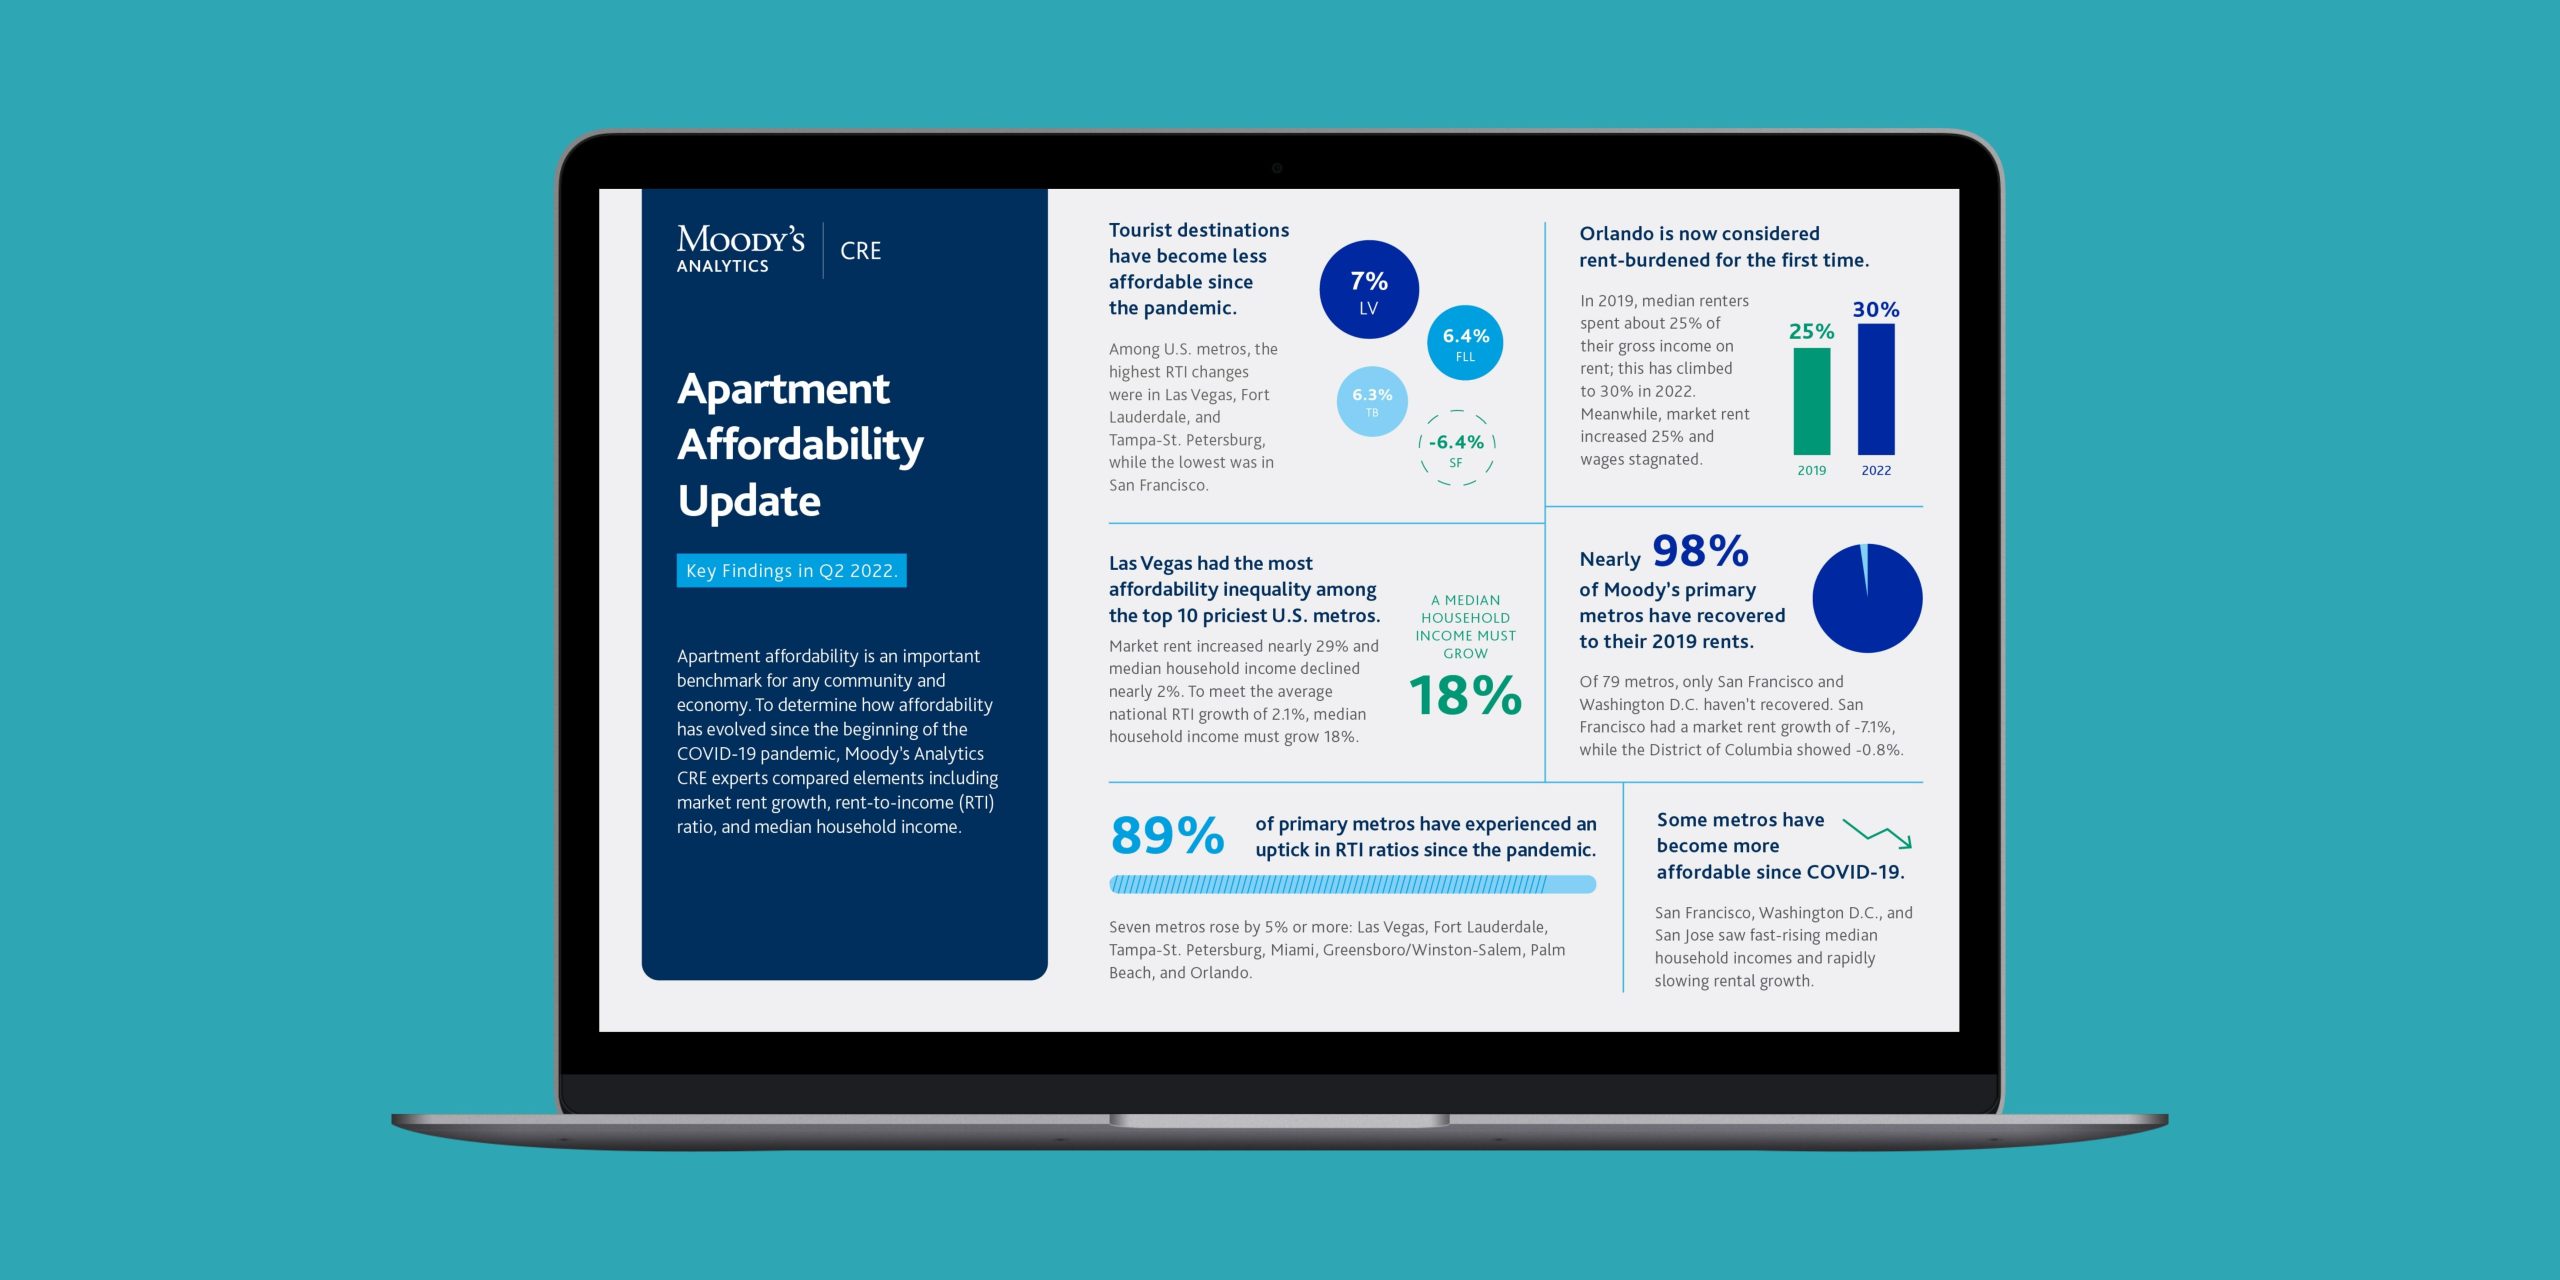
Our task was to create an infographic for Moody’s Analytics that could distill their Q2 2022 findings on apartment affordability into a clear and compelling visual narrative. With a brief that desired a design heavy on data and statistics, we rolled up our sleeves and dove in. This required a delicate balance — maintaining the integrity of the data while presenting it in a way that would captivate and inform the audience. We leveraged design elements to highlight critical figures and allow the data to tell a story. The final product resulted in an infographic that effectively conveyed the key points in an engaging and easy-to-understand format.